Step 1: Access the Geonode Dashboard
- Log in to your Geonode account.
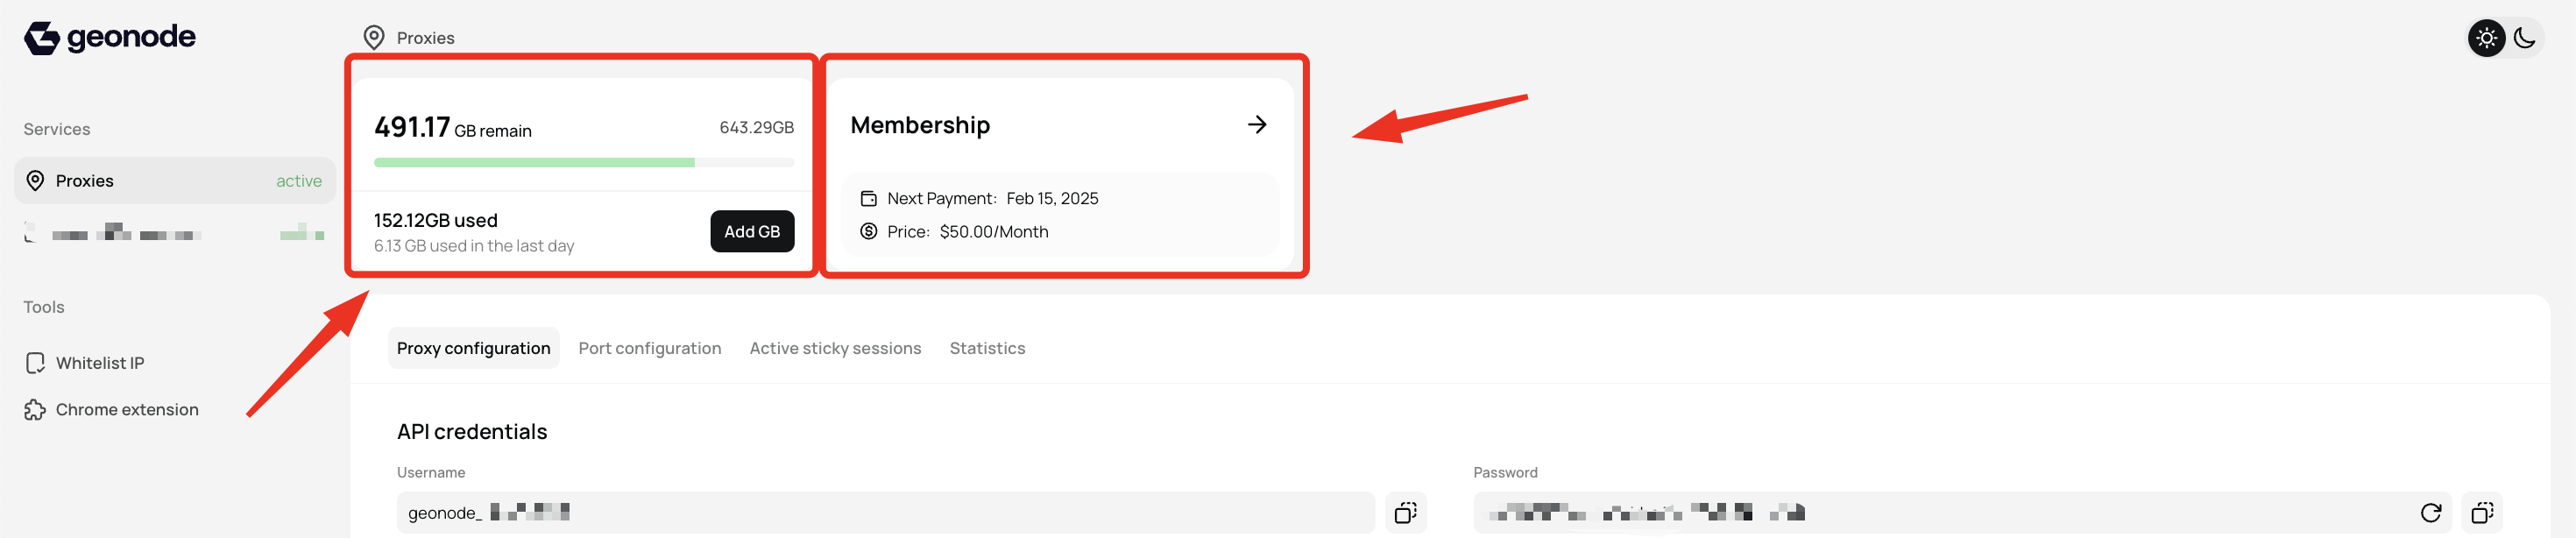
- Navigate to the Dashboard to view an overview of key details, including:
- Available bandwidth
- Billing cycle and renewal dates
Step 2: View Usage Statistics
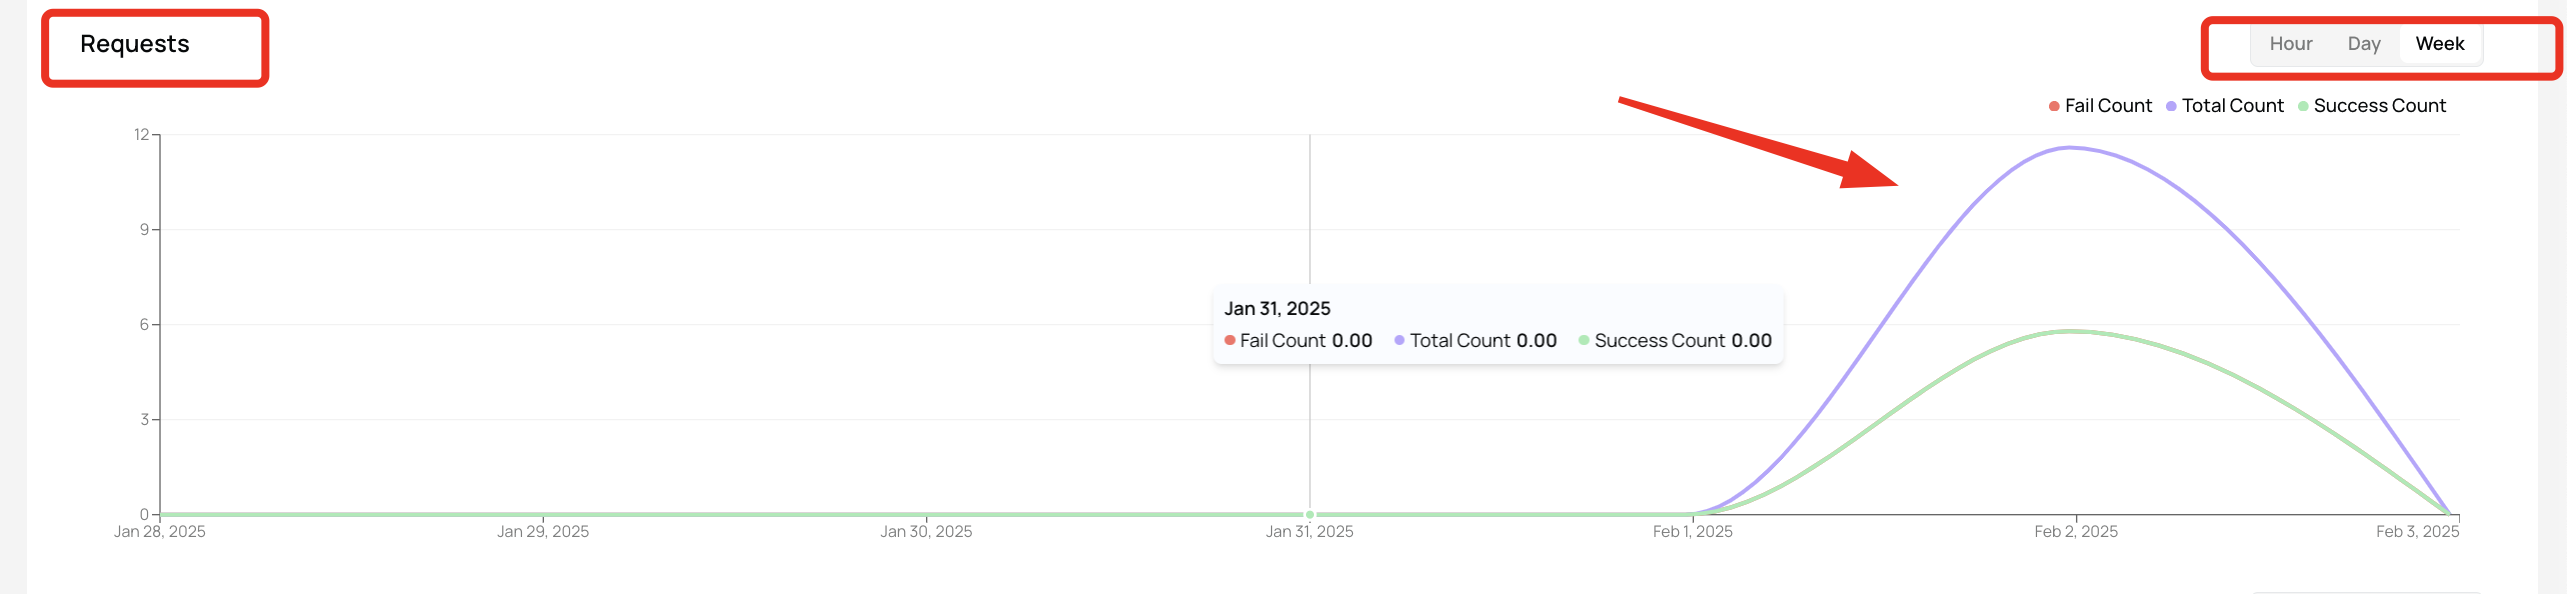
In the Statistics section, you can monitor detailed proxy performance metrics.1. Request Metrics
A graphical representation of your request activity, including:- Successful requests - Requests that were processed successfully.
- Failed requests - Requests that encountered errors or blocks.
- Total requests sent - The total number of proxy requests made.
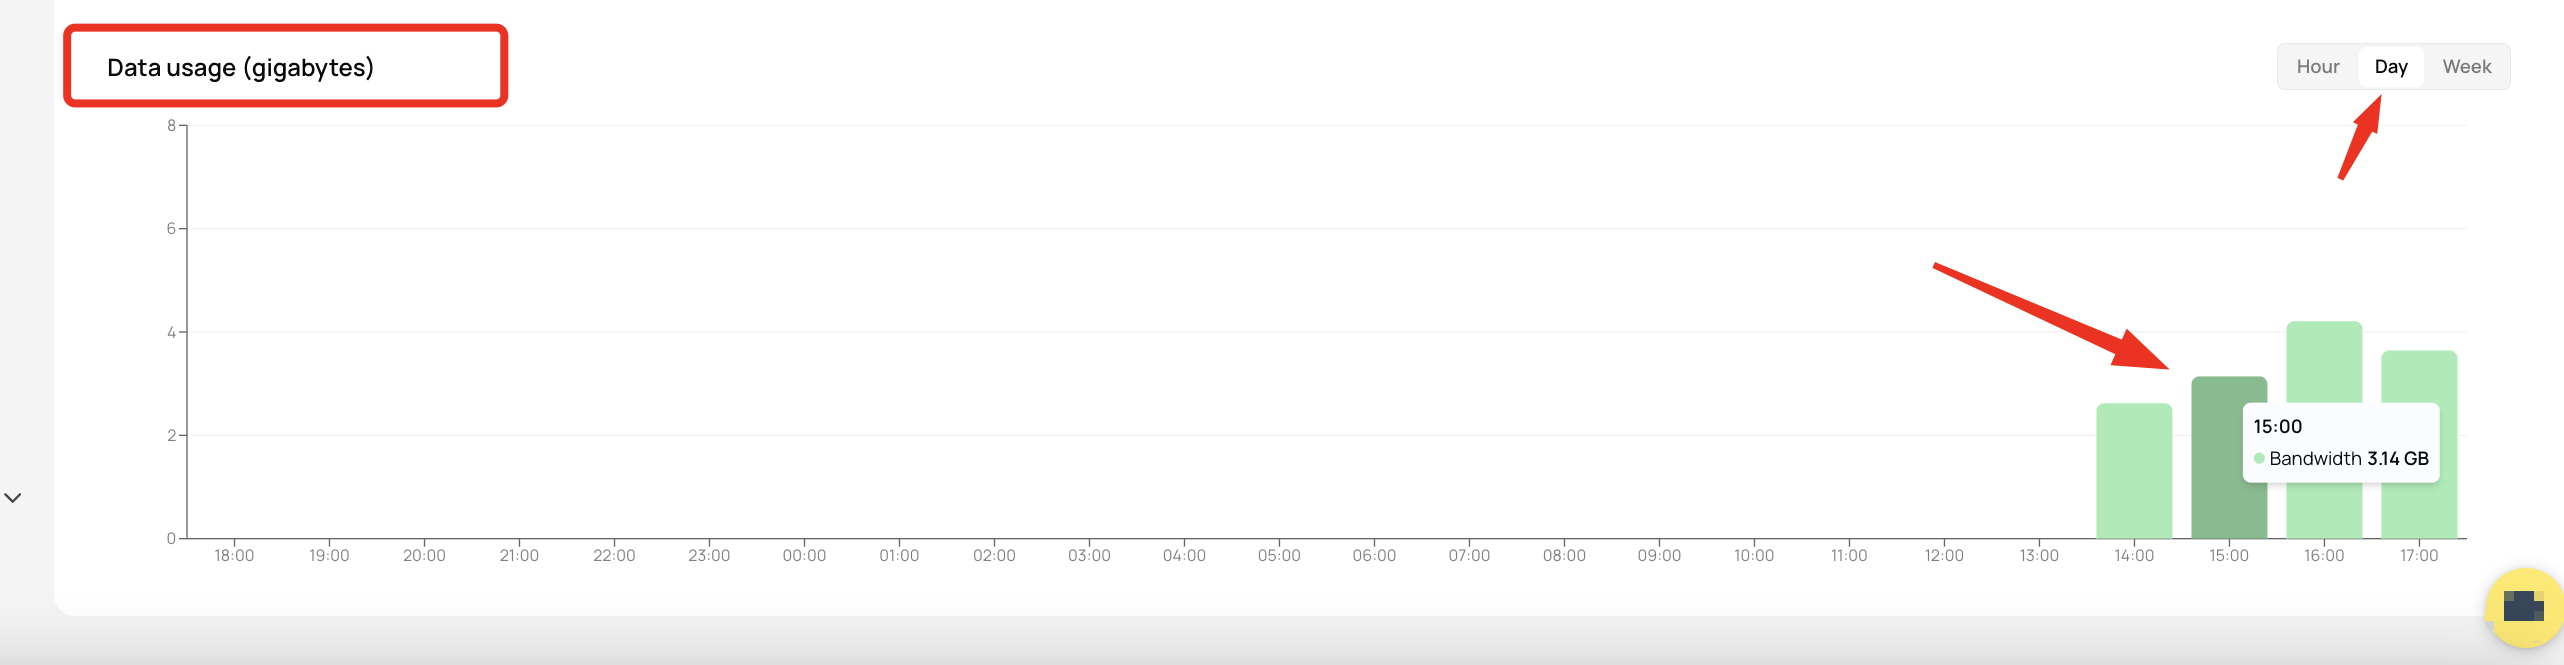
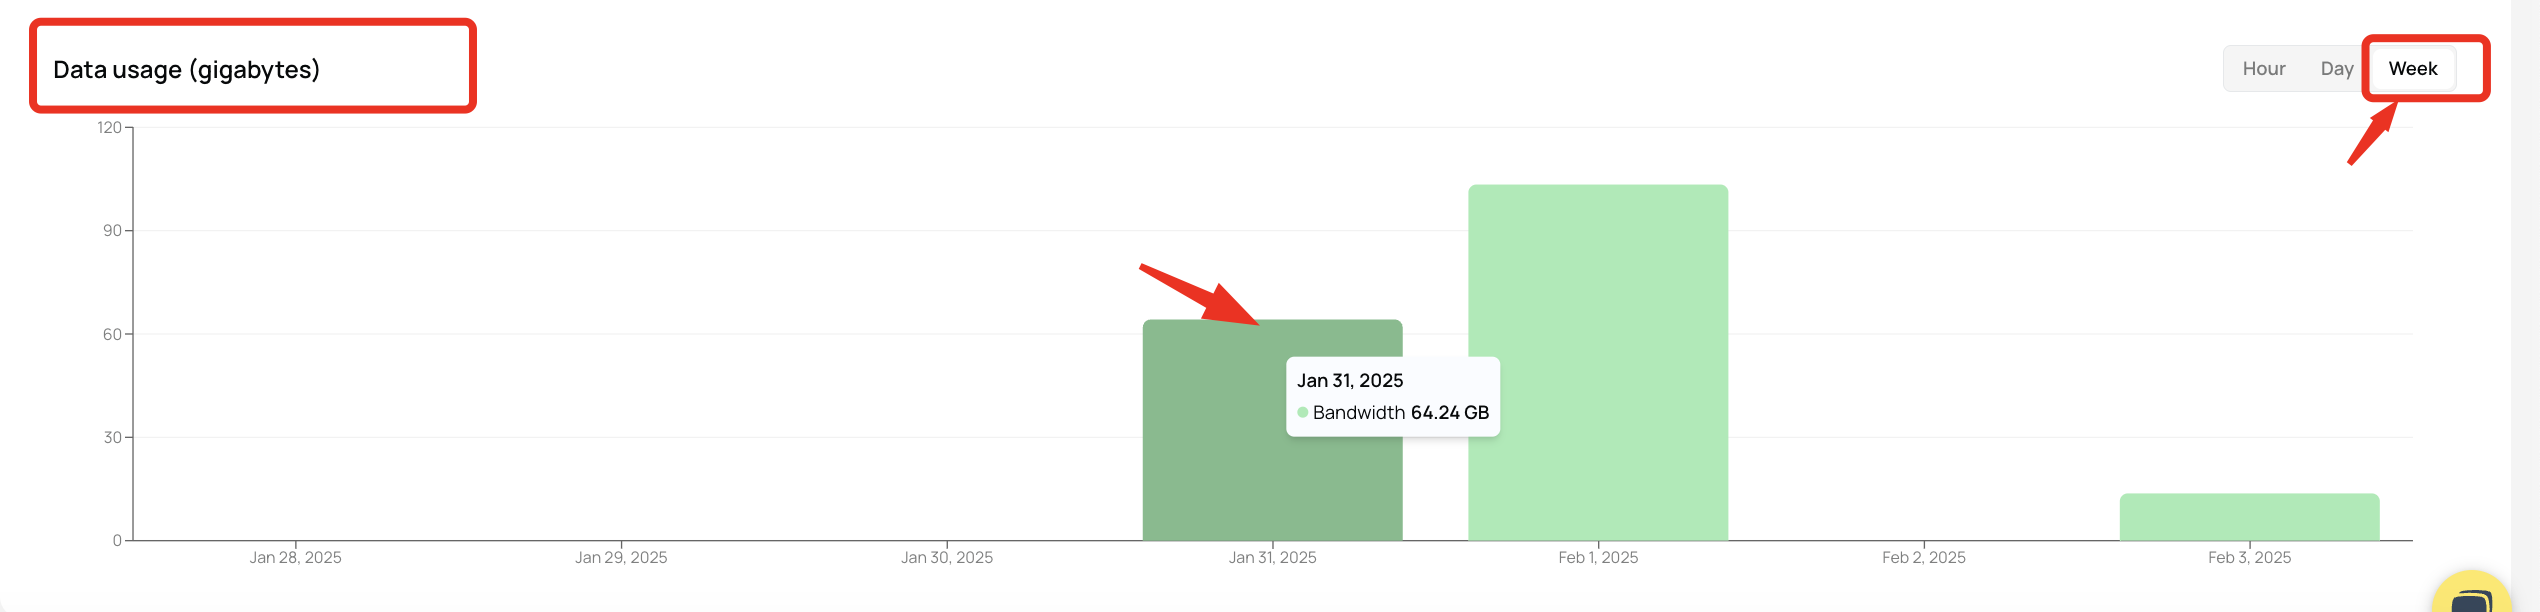
2. Data Usage Monitoring
- Daily Bandwidth Consumption - Track how much data you use each day.
- Hourly Data Usage Trends - Analyze peak usage times to optimize resource allocation.
Final Tips
- Monitor usage regularly to ensure efficient proxy performance.
- Analyze peak usage times to adjust settings and optimize bandwidth.
- Track failed requests to troubleshoot issues and improve success rates.