> ## Documentation Index
> Fetch the complete documentation index at: https://geonode.mintlify.site/llms.txt
> Use this file to discover all available pages before exploring further.
# Usage Stats & Analytics
> Learn how to monitor and optimize your proxy usage with Geonode's analytics tools.
This guide will show you how to track, analyze, and optimize your proxy usage using Geonode's dashboard. Monitoring usage statistics helps you manage resources efficiently and improve performance.
***
## **Step 1: Access the Geonode Dashboard**
1. Log in to your Geonode account.
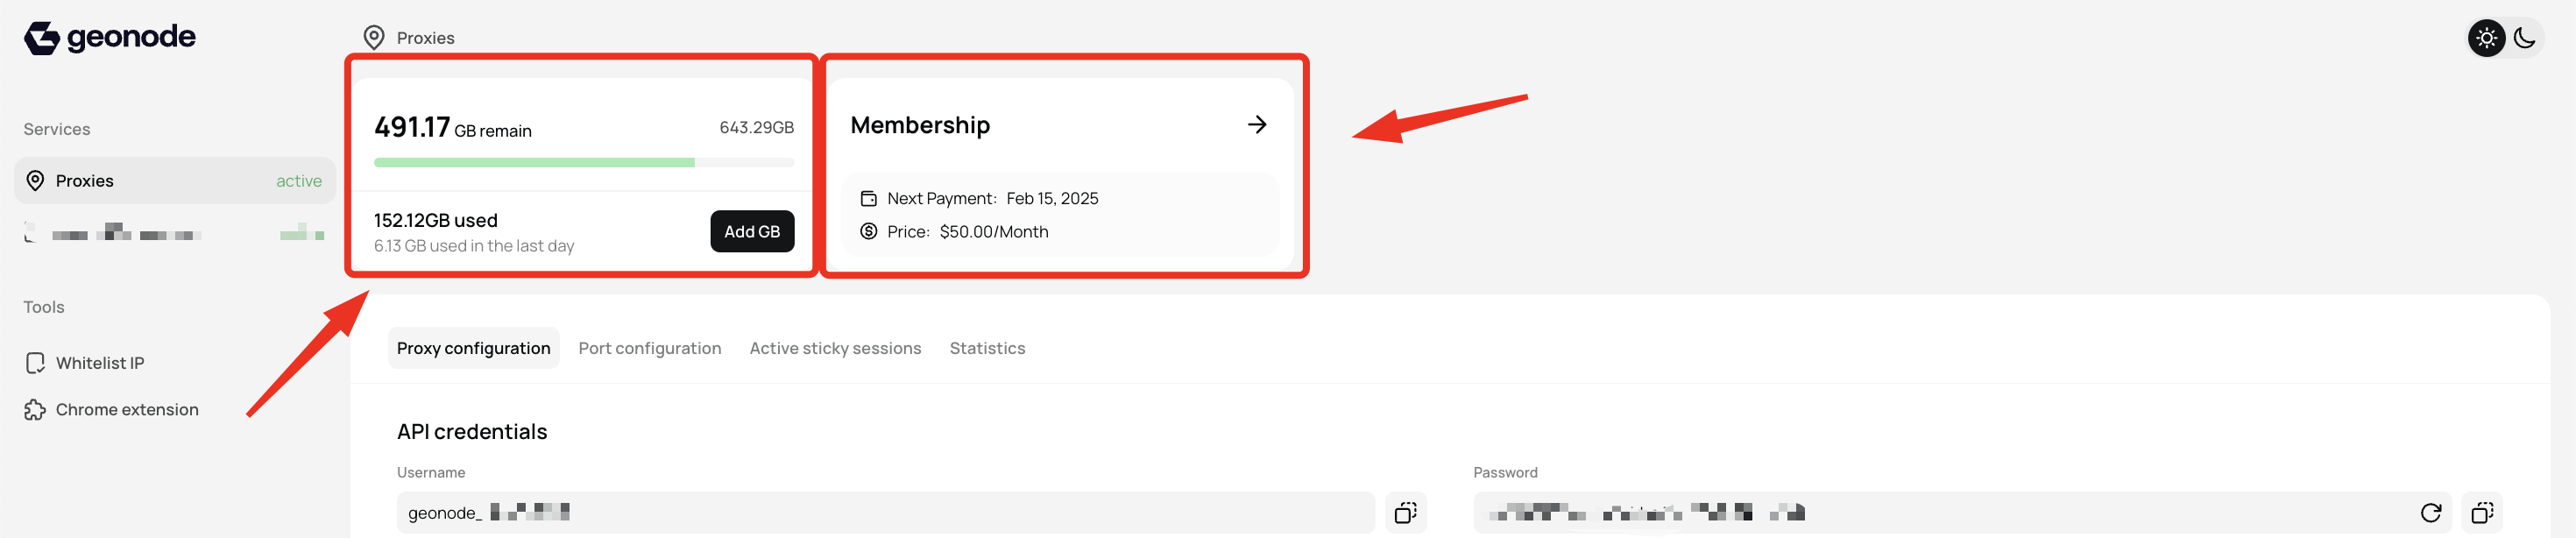
2. Navigate to the Dashboard to view an overview of key details, including:
* Available bandwidth
* Billing cycle and renewal dates
 ***
## **Step 2: View Usage Statistics**
In the **Statistics** section, you can monitor detailed proxy performance metrics.
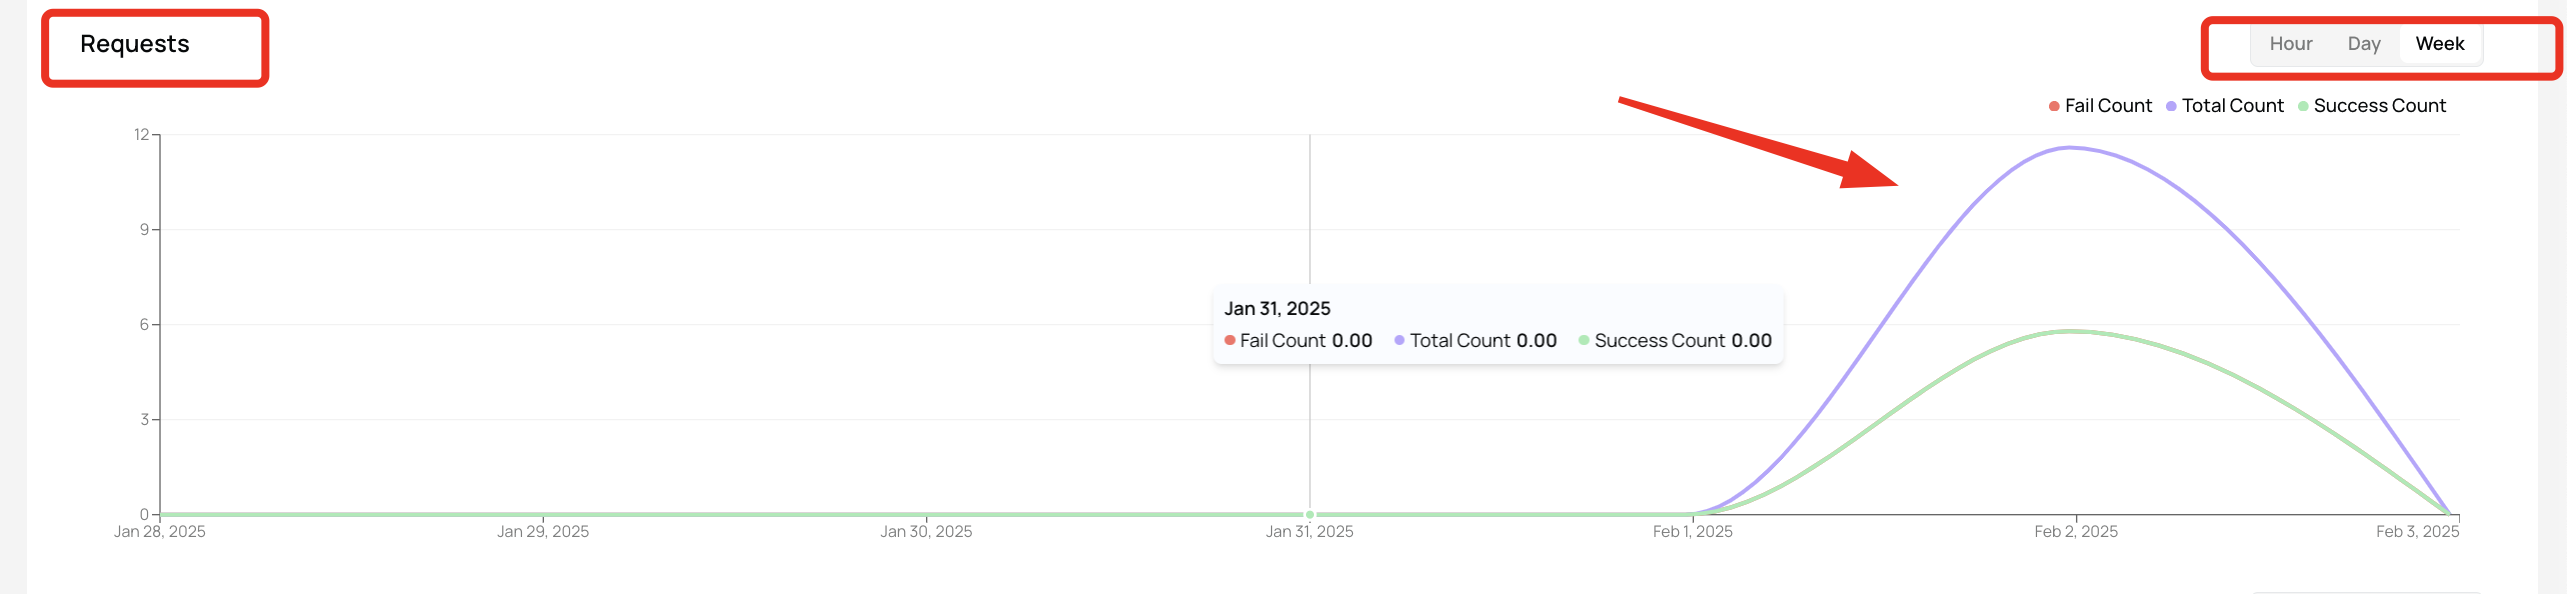
### **1. Request Metrics**
A graphical representation of your request activity, including:
* Successful requests - Requests that were processed successfully.
* Failed requests - Requests that encountered errors or blocks.
* Total requests sent - The total number of proxy requests made.
***
## **Step 2: View Usage Statistics**
In the **Statistics** section, you can monitor detailed proxy performance metrics.
### **1. Request Metrics**
A graphical representation of your request activity, including:
* Successful requests - Requests that were processed successfully.
* Failed requests - Requests that encountered errors or blocks.
* Total requests sent - The total number of proxy requests made.
 ### **2. Data Usage Monitoring**
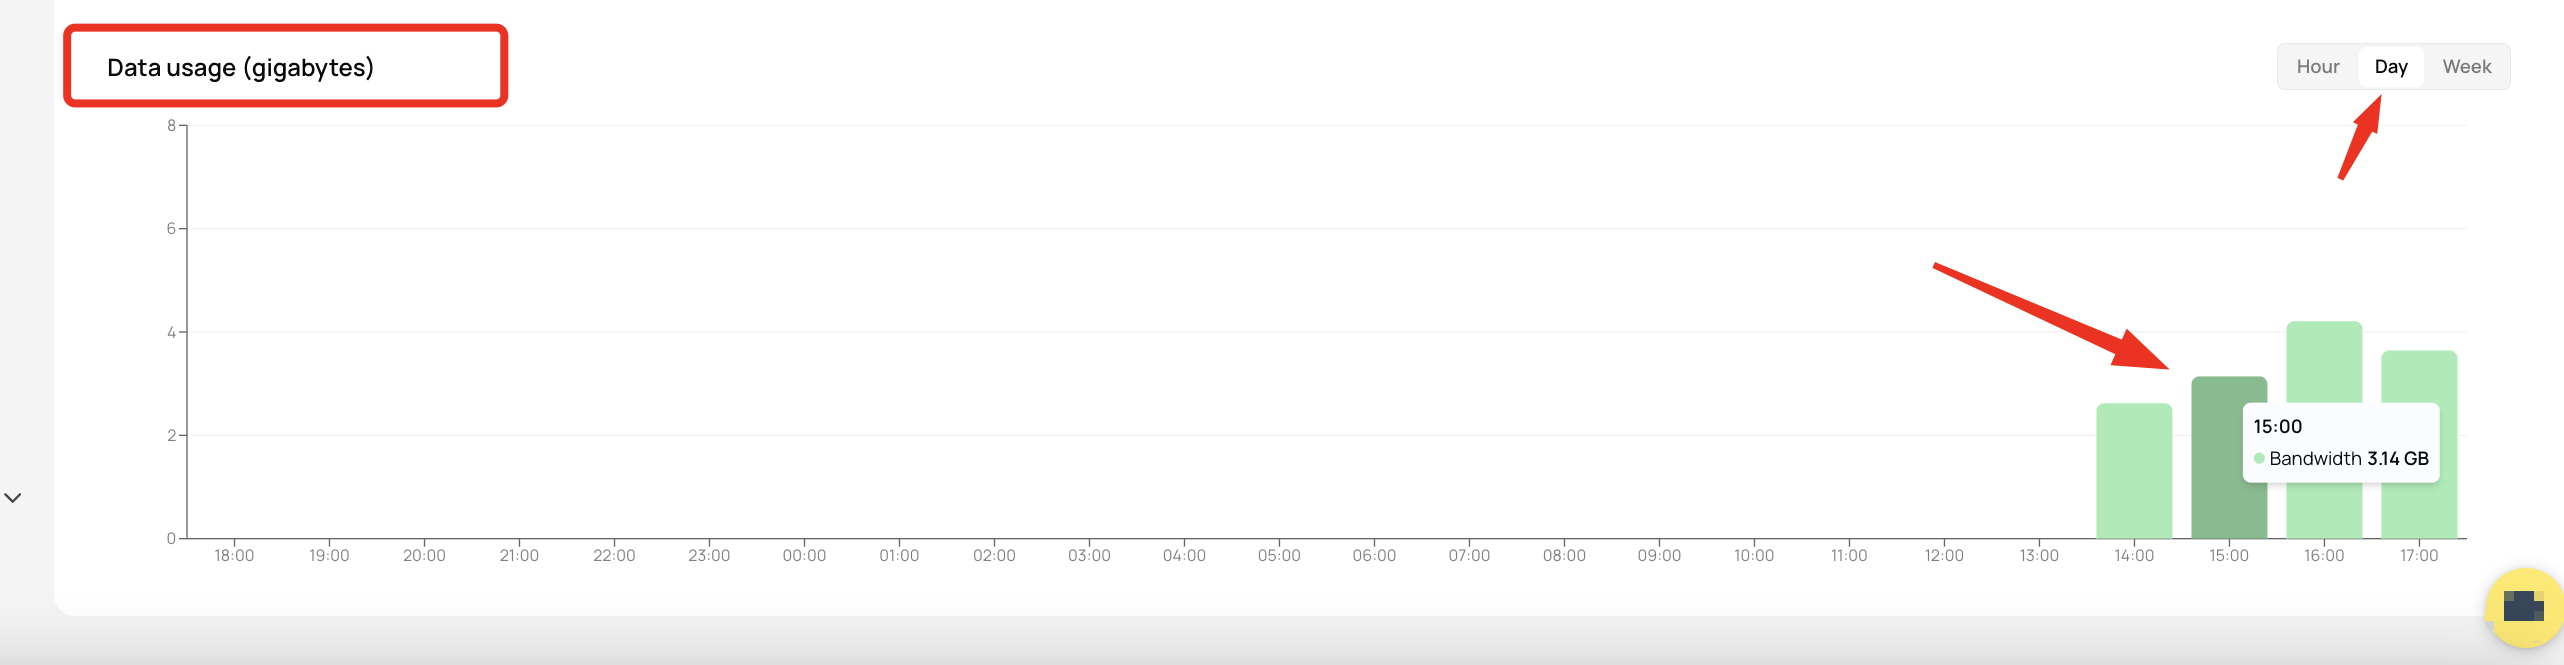
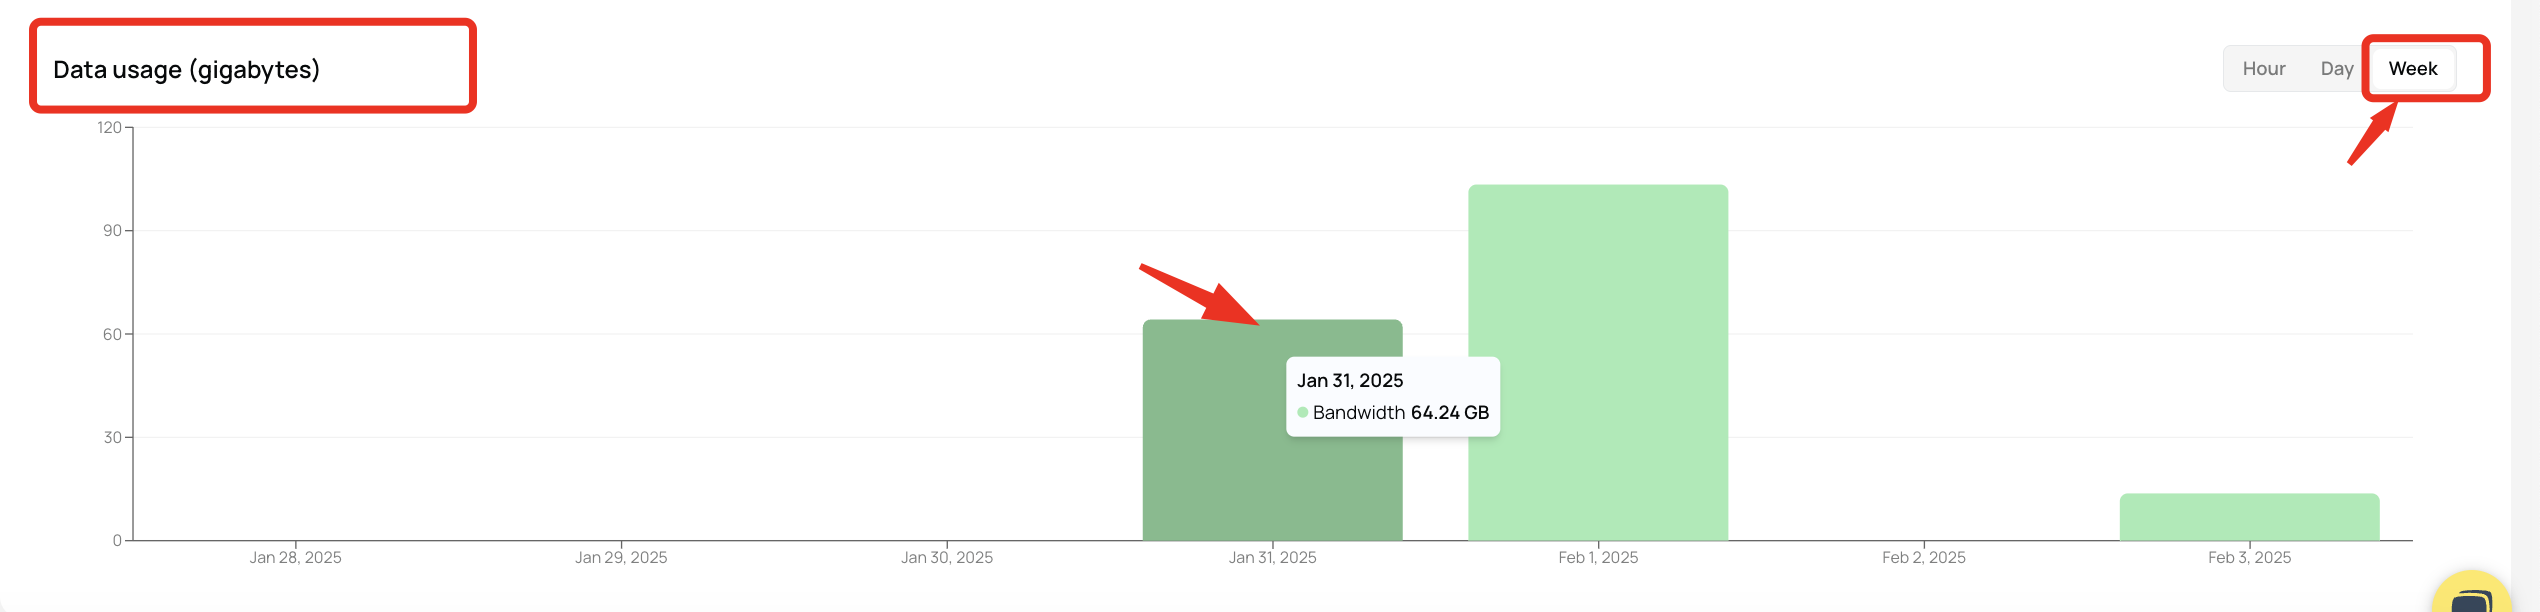
* **Daily Bandwidth Consumption** - Track how much data you use each day.
* **Hourly Data Usage Trends** - Analyze peak usage times to optimize resource allocation.
This information helps you assess proxy performance, identify inefficiencies, and improve bandwidth management.
### **2. Data Usage Monitoring**
* **Daily Bandwidth Consumption** - Track how much data you use each day.
* **Hourly Data Usage Trends** - Analyze peak usage times to optimize resource allocation.
This information helps you assess proxy performance, identify inefficiencies, and improve bandwidth management.
 ***
## **Final Tips**
* Monitor usage regularly to ensure efficient proxy performance.
* Analyze peak usage times to adjust settings and optimize bandwidth.
* Track failed requests to troubleshoot issues and improve success rates.
By using Geonode's analytics tools, you can maximize efficiency, manage costs, and optimize proxy performance.
***
## **Final Tips**
* Monitor usage regularly to ensure efficient proxy performance.
* Analyze peak usage times to adjust settings and optimize bandwidth.
* Track failed requests to troubleshoot issues and improve success rates.
By using Geonode's analytics tools, you can maximize efficiency, manage costs, and optimize proxy performance.